Featured Paper
Primate cerebellar scaling in connection to the cerebrum: a 34-species phylogenetic comparative analysis
By Neville Magielse
date: Mar 2023
The cerebellum: motor and much more
The cerebellum has long been viewed as a functionally homogenous structure, only involved in the fine control of the motor system. However, over the last decades it has become increasingly clear that the cerebellum contributes to wide-ranging higher-order associative function, such as abstract reasoning, theory of mind, and affect regulation, as well. Structurally, the cerebello-cerebral system may support these functions through reciprocal loops that connect associative cerebral cortical areas to distinct cerebellar cortical areas. Key amongst these areas are crura I and II (the ansiform area) that connects reciprocally to prefrontal, parietal, and temporal cortices. These cerebellar ‘association’ areas develop relatively late, are involved in (among others) social, executive, and language functions, are often implicated in neurodevelopment and neurodegenerative disorders/conditions, and most importantly: their volume and surface area has become relatively (versus the rest of the cerebellum and cerebrum) massive in humans versus other primates. By using a large comparative primate dataset, we first explored the covariation of volumes of the cerebellum and cerebral cortex across primates, after which we zoomed in to explore primate scaling “rules” for the ansiform area specifically.
Associative ability-supporting adaptations
After obtaining volumes from manual cerebellar segmentations, we found that primate cerebello-cerebral phenotypes supported a model of random time-varying evolution. Using this model and the primate phylogenetic tree (the data family structure), we computed a model the enabled us to go ‘back in evolutionary time’. This model revealed the evolutionary dynamics of cerebellar, cerebral, and ansiform area volumes as well as their ratios. Here we observed that versus the rest of the primate sample, hominoids as well as Strepsirrhini (wet-nosed primates) clades – and especially lemurs – had relatively large cerebella, whereas relatively large ansiform areas appeared a trait prominent in hominoids. Regressing amongst these phenotypes while correcting for the evolutionary relationships of the primate sample, we found that while over the primate lineage the cerebellum expands slightly slower than the cerebrum does, the ansiform area expands at a much higher (roughly 1.3x) rate. These allometries suggest that the ansiform area has a special place in primate evolution, being scaled up tremendously. Moreover, it challenges previous notions of human uniqueness, as the observed relatively large areas are an expected outcome in humans based on this rule. Although we often look for specific human specializations, primate-general scaling may already lead to emergent human abilities, through sheer numbers of neurons and connections.
Moving to fine-grained mapping of cerebellar cellular complexity
Embedding these observations in a framework of cerebellar functional diversity (a multi-discipline effort), suggest how much we do not yet know about the structure underlying this diversity. The BigBrain offers a unique resource to further explore the structural heterogeneity of the cerebellum. In one of our coming projects, we aim to specifically assess Purkinje cell distribution across the cerebellar cortex in BigBrain. Purkinje cells, being the only output neuron of the cerebellar cortex, allow us to assess whether these (evolutionary) hotspots display differential cellular organization, perhaps supportive of cerebellar functional diversity.
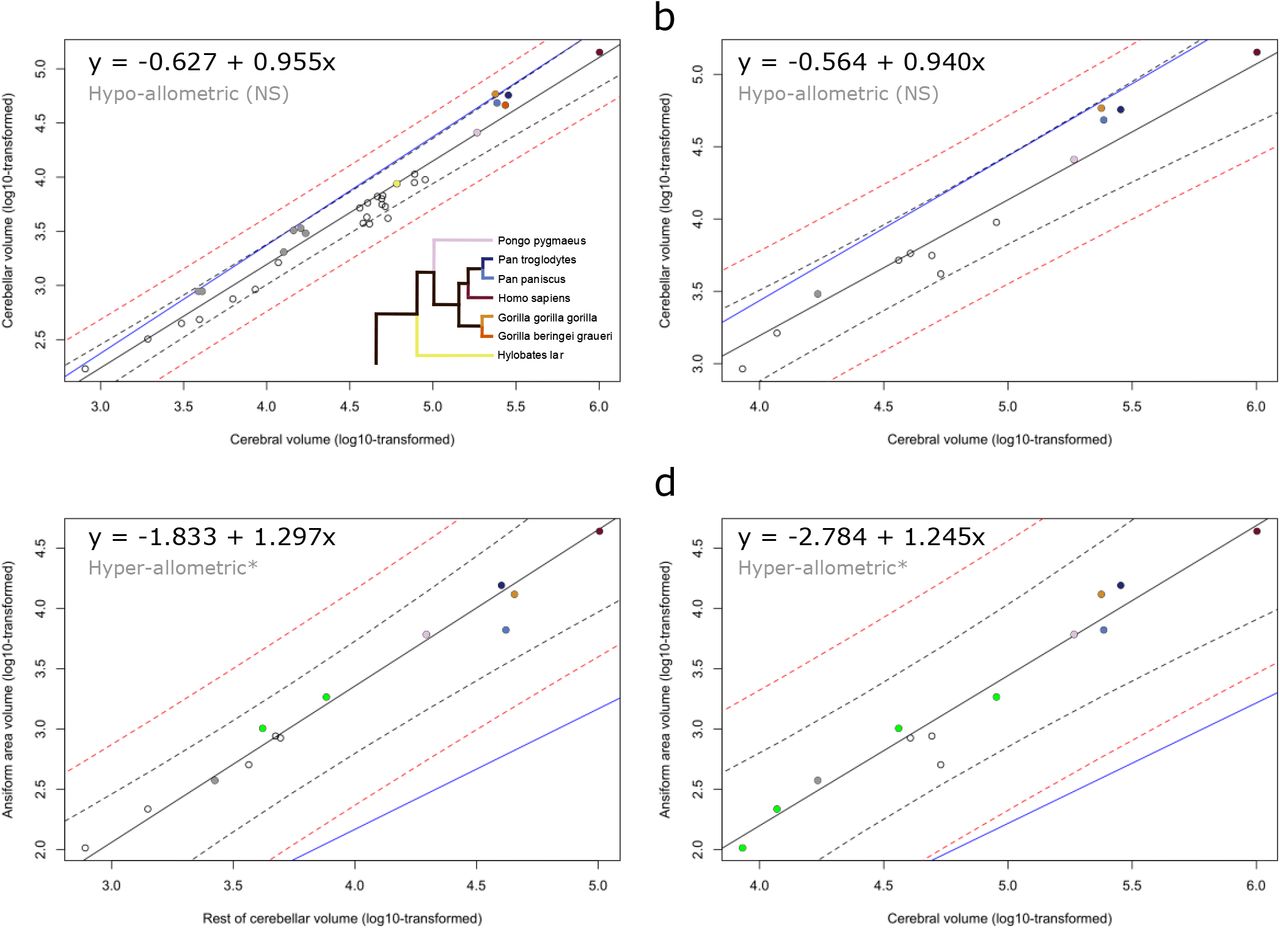
Figure 5 from the manuscript: phylogenetic generalized least squares regression in the primate sample shows roughly 1: (~0.95 in the full sample; a) scaling of the cerebellum to the cerebrum, whereas the ansiform area scales at a ~1.25 (to cerebrum; d) to ~1.3x (to rest of cerebellum; c) rate. See (a) for the legend for hominid species. Dark grey dots indicate lemurs in the sample, green dots indicate species exceeding the primate sample’s general trend for ansiform area scaling, showing that apes are not unique in this regard.